Fourier transform — computer vision in the browser
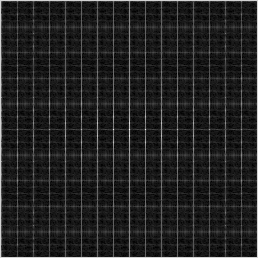
The Fourier transform re-expresses an image as a sum of waves — the frequency domain, where repetitive texture and periodic noise become obvious dots. This builds a striped pattern and shows its magnitude spectrum. Run it live and change the stripe spacing to watch the spectrum move.
Example code (Python / OpenCV)
"""
Fourier transform

The Fourier transform re-expresses an image as a sum of waves — the frequency domain, where repetitive texture and periodic noise become obvious dots. This builds a striped pattern and shows its magnitude spectrum. Run it live and change the stripe spacing to watch the spectrum move.
"""

import cv2
import numpy as np

# A striped pattern has a clear signature in the frequency domain
xs = np.arange(256)
cols = 127 + 120 * np.sin(2 * np.pi * xs / 16)     # vertical stripes (tweak the 16)
rows = 60 * np.sin(2 * np.pi * xs / 40)            # a slower horizontal ripple
img = np.clip(cols[None, :] + rows[:, None], 0, 255).astype(np.uint8)
cv2.imshow("pattern", img)

f = np.fft.fftshift(np.fft.fft2(img.astype(np.float32)))
mag = 20 * np.log(np.abs(f) + 1)
mag = cv2.normalize(mag, None, 0, 255, cv2.NORM_MINMAX).astype(np.uint8)
cv2.imshow("magnitude spectrum", mag)   # bright dots = the pattern's frequencies